
The interactive digital tool we built replaced the narrative-based Research, Science and Innovation System Performance Report. It was designed to be fast, beautiful and responsive.
Scoping, brief and concept development
We began by talking to the sector’s main audiences to find out what they had valued in previous reports and what would be essential in an online version. Their feedback informed a reverse brief for the client and helped shape the content of the new report.
The conversation confirmed the need to provide a commentary about trends shown by the data rather than simply providing graphs for readers to interpret. A requirement to produce a downloadable PDF version of the report for printing was also highlighted.
Meeting MBIE branding and accessibility standards
We met with the client’s communications, digital and brand teams early on to clarify their expectations for the report’s presentation and usability. We were then able to ensure the online tool looked like an MBIE publication, and was intuitive to use and engaging to read.
The report was required to meet the WCAG 2.1 level AA accessibility standards. To ensure every page conformed reliably to this standard, we used automated testing practices. These included the browser testing framework Cypress configured with an accessibility plugin.
Presenting a complex report simply
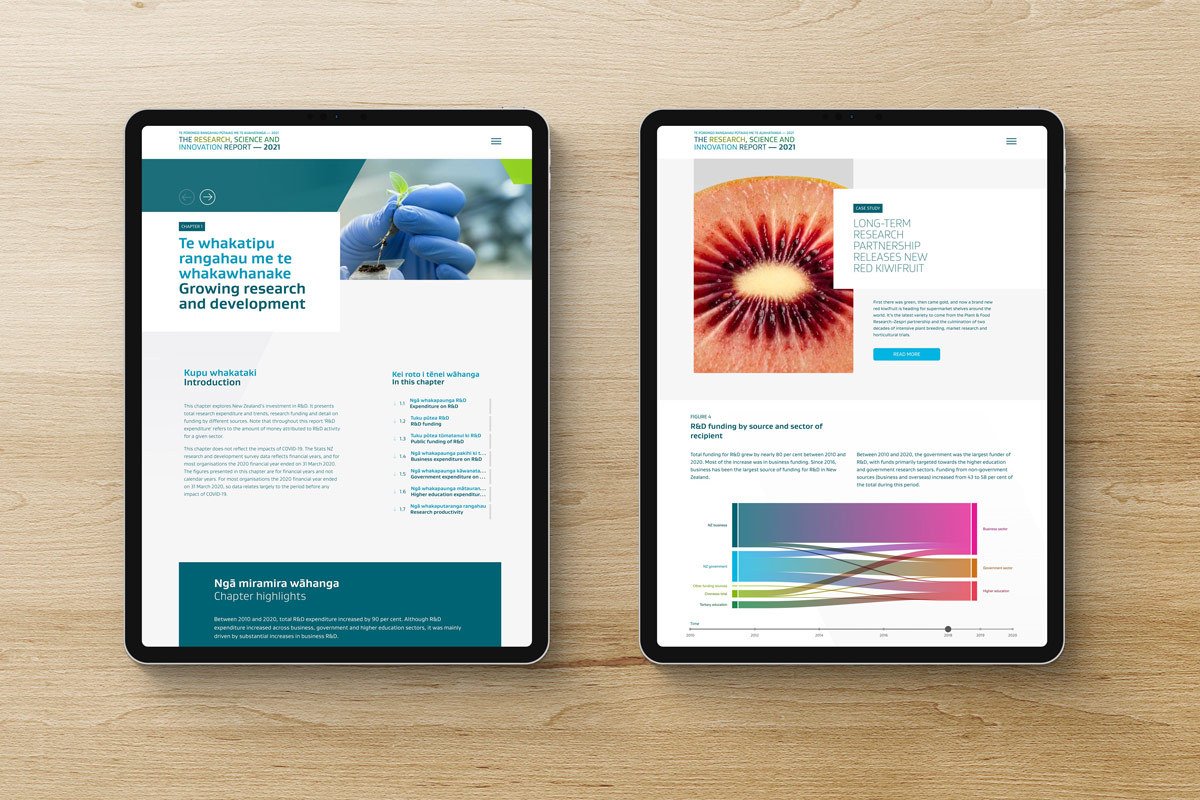
The online report was made up of quite different types of content: case studies, chapter summaries, commentary, information panels, graphs and data. One of the main challenges was to weave these elements together to create a cohesive product.
We chose Gatsby (a JavaScript framework built on top of React) as a base for the report. From this base we set up the infrastructure that specified how to build the report including accessing data for pages and charts and creating bespoke pages.
Using a system of reusable components allowed us to meet the need for a tool that was flexible and easy to modify. The components were tested across extremes to confirm they would be robust in every situation. The reproducible approach we took also allows MBIE to update the content and data for future reports without having to start from scratch.
Designing an online report, not a website
Although it was presented in a digital format, the report was designed to lead a reader through from start to finish. This mimicked the style of previous RSI reports. Although readers can click around to explore different chapters, they are encouraged to follow a linear flow through the report.
A clear overview of the subject and content of each chapter was presented up front. Clear navigation through each chapter was provided as well as the choice to return to the contents page. Locking together graphs and commentary ensured readers would always have interpretation available beside each graph.
Case studies highlight research in action
The report’s nine case studies featured a wide range of people and industries, including areas where New Zealand research is world leading. They demonstrated what RSI funding achieves in practical terms, and how it is tied to questions related to people, situations and issues facing the country. To appeal to online readers, the case studies were kept short and were attractively illustrated.
Information panels were dotted throughout to highlight Vision Mātauranga initiatives, funding sources, areas of investment and new developments related to RSI.
Transparent data management
The RSI is a major national report. Its findings are used to inform decision-making around science investment so a high level of trust in the data presented was essential. We used reproducible processes to provide transparency and verify the data and analyses as they were drawn into the report.
Working closely with the data scientists at MBIE ensured that we created efficient data management processes based on their existing infrastructure. This approach allowed the staff to retain full visibility of the code, as well as the ability to edit, maintain and verify each step of the data replication and transformation into the tool.
We also helped the client set up reproducible processes (such as issue tracking and version control) for updating, checking and analysing data, according to best practice.
Project team
Ignatius Menzies, Michael Parkin, Yvan Richard, Finlay Thompson, Sarah Wilcox, Simon Winter, Pep Zuijderwijk.
About the report
The Research Science and Innovation System Performance Report is a snapshot of how the New Zealand science and innovation system is performing. It covers people, skills, knowledge, infrastructure and funding across government as well as education and business.
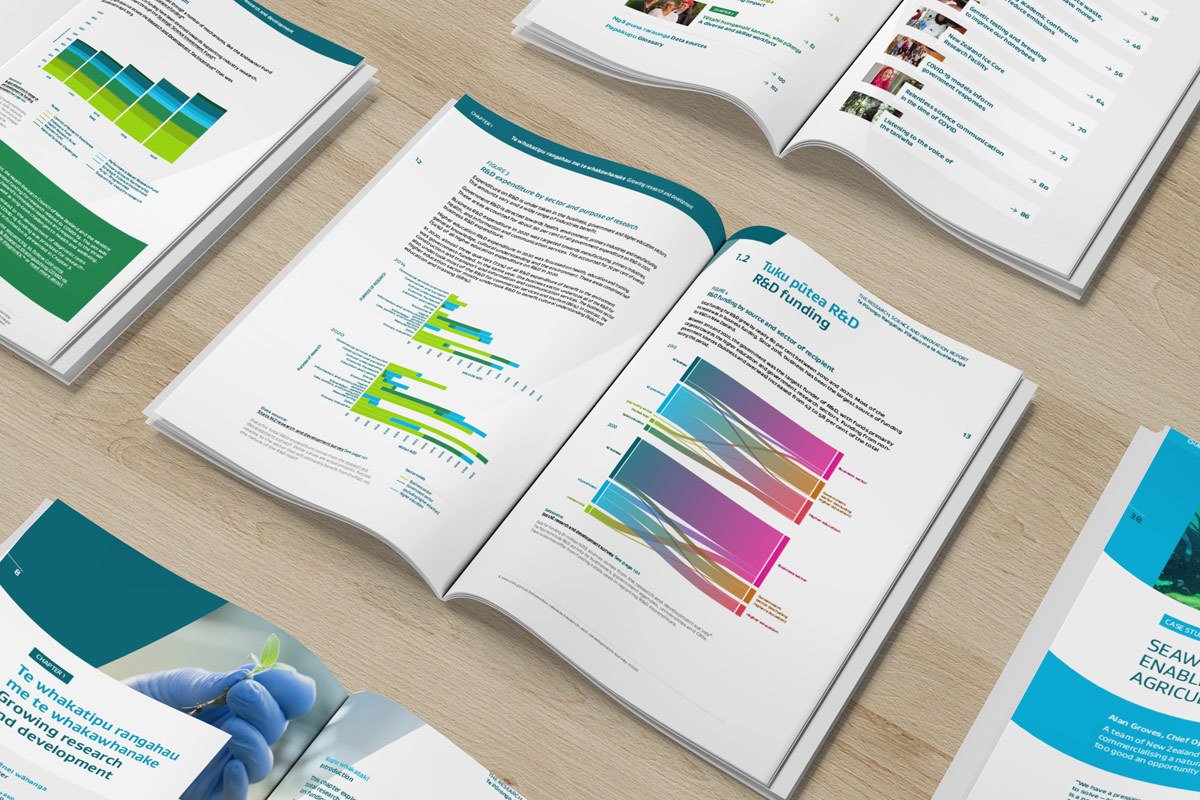
The report is a biennial publication, with previous reports coming out in 2016 and 2018. This is the first time it has been designed as an interactive digital tool, accompanied by a downloadable PDF version for printing.
I thought the ability to interact with graphs in a browser greatly improved their accessibility and made the content much easier to understand than a PDF version.
The devil is often in the detail – R&D spending might be going up, but rapid growth in one sector might mask a decline in another. The graphs need to convey that at a glance.
I also loved the fact that I could access the data directly as a downloadable CSV file from my browser rather than having to follow hyperlinks.
The report supports informed debate about the New Zealand research system. I would like to see it expanded and enhanced in a number of areas to improve policy, planning and practise across the system.
Professor Shaun Hendy
Chief scientist and co-founder
Toha .