Our work with the Social Wellbeing Agency produced an interactive map of cyclone impacts overlaid with infrastructure and demographic data.
The map demonstrates the crucial role that data has played in identifying the land and community characteristics of areas impacted by adverse weather in early 2023. It's the first time these two approaches have been combined for New Zealand. The map is also supporting planning for the response and recovery.
Aphra Green, Deputy Chief Executive, Policy, Data and Insights of the Social Wellbeing Agency (SWA) Toi Hau Tāngata says the agency had built a demographic explorer with community information, but being able to combine this with geospatial data was a big advantage.
“By having satellite data mapped to a suburb level we can see the land impacts and match this with the wellbeing and demographic characteristics of a community”, she said.
Data from the Sentinel-1 satellite was used to capture the extent of flooding during the cyclone. Sentinel-2 satellite data was used to capture impacts from the flooding such as silt deposits, slips or persistent inundation. All datasets were publicly available.
The physical impacts of the cyclone – flooding, slips and silt – are displayed in layers on the map. Users can also choose to display features such as the percentage of area impacted, the length of roads, farmed area, and buildings, schools, hospitals and supermarkets within an impacted area. Another layer displays an area’s deprivation index.
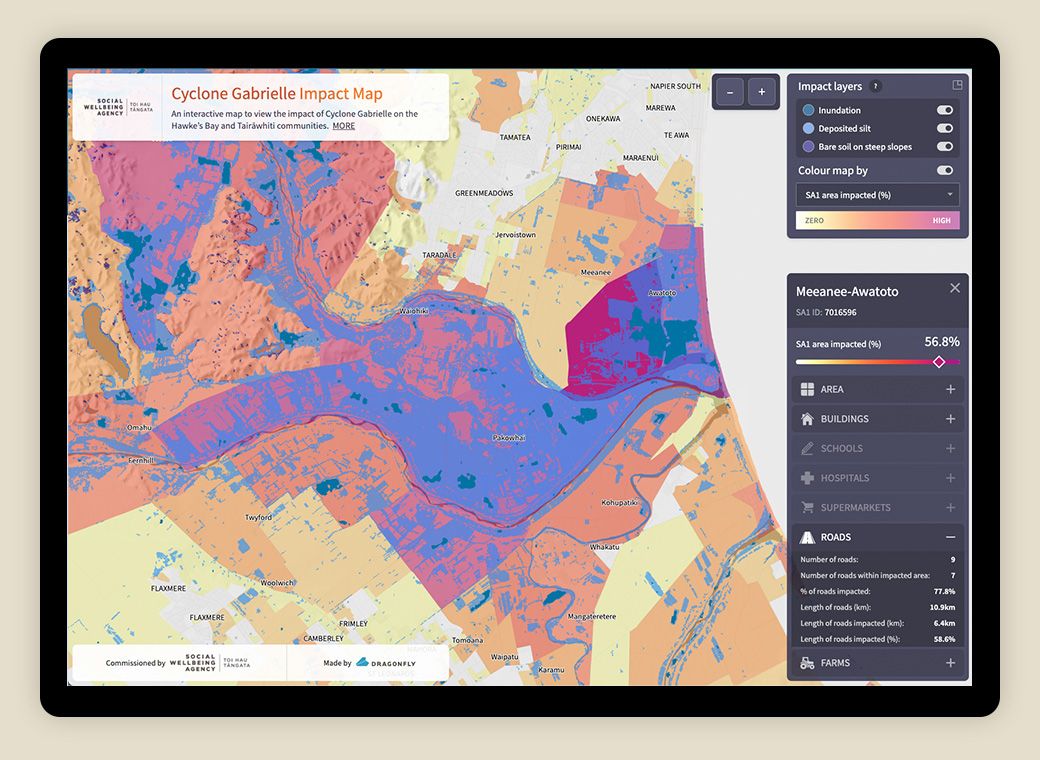
SWA believes the Cyclone Gabrielle Impact Map and its Community Insights Explorer provide a shared understanding of community need and a high-level view of where and how recovery efforts could be targeted.
“It's a platform for community and government to collaborate in a recovery process. As a starting point, we hope it helps people ask better questions rather than providing all the answers.”
The combined explorer and map was released in April and feedback so far has been positive from those who are using it for community information. “We’ve promoted the explorer and it’s been picked up by many different users, all mining it for their own needs.”
One organisation is tailoring its relief efforts based on information they discovered about the languages spoken in a cyclone-damaged area. “Even a little thing like knowing the languages spoken in a community helps inform how to communicate in a response and recovery effort.”
The impact map has been built to enable the impacts of future severe weather events, tsunami or eruptions to be displayed rapidly.
“There are many possibilities for anticipating future storm events alongside the wellbeing data. It’s valuable for disaster relief and recovery but also for targeting community preparedness in areas that may need a little extra help.”
The team from Dragonfly and the Social Wellbeing Agency included data scientists, developers, policy analysts and a GIS specialist.
More information
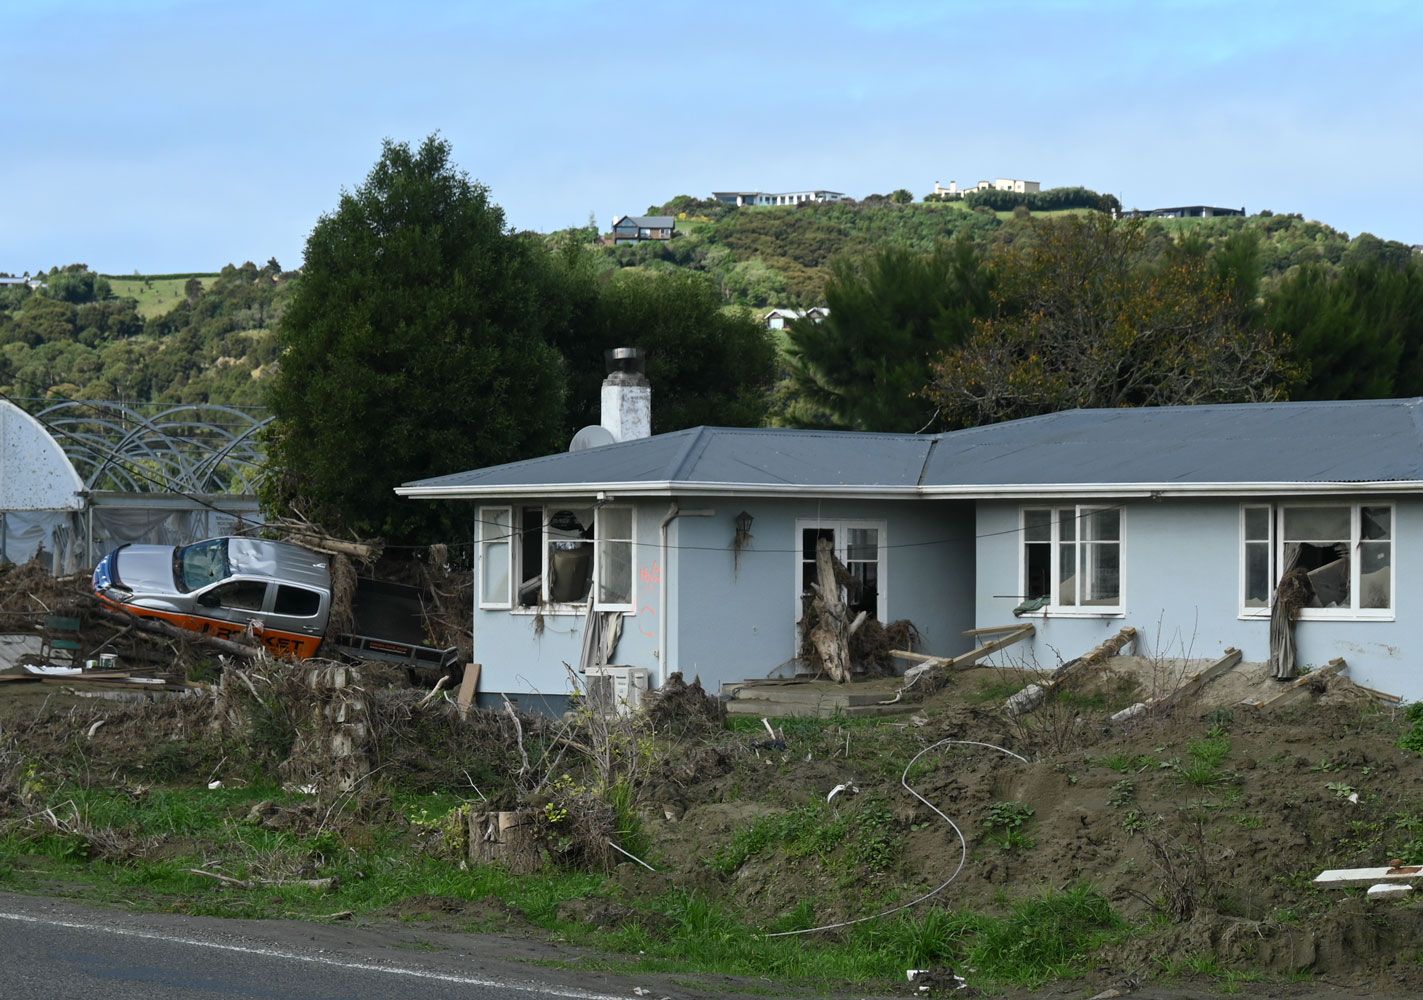
Top image: Flood-damaged property Esk Valley. Sarah Wilcox