An initial map of flooding in Hawke’s Bay used synthetic aperture radar data from a snapshot taken on Tuesday 14 February 2023 during the cyclone. It was updated with information collected on February 19 and 21, which showed the extent of silt and slips in the region. A further update shows impacts over the whole North Island.
Explore the Cyclone Gabrielle Impact Map we produced in collaboration with the Social Wellbeing Agency.
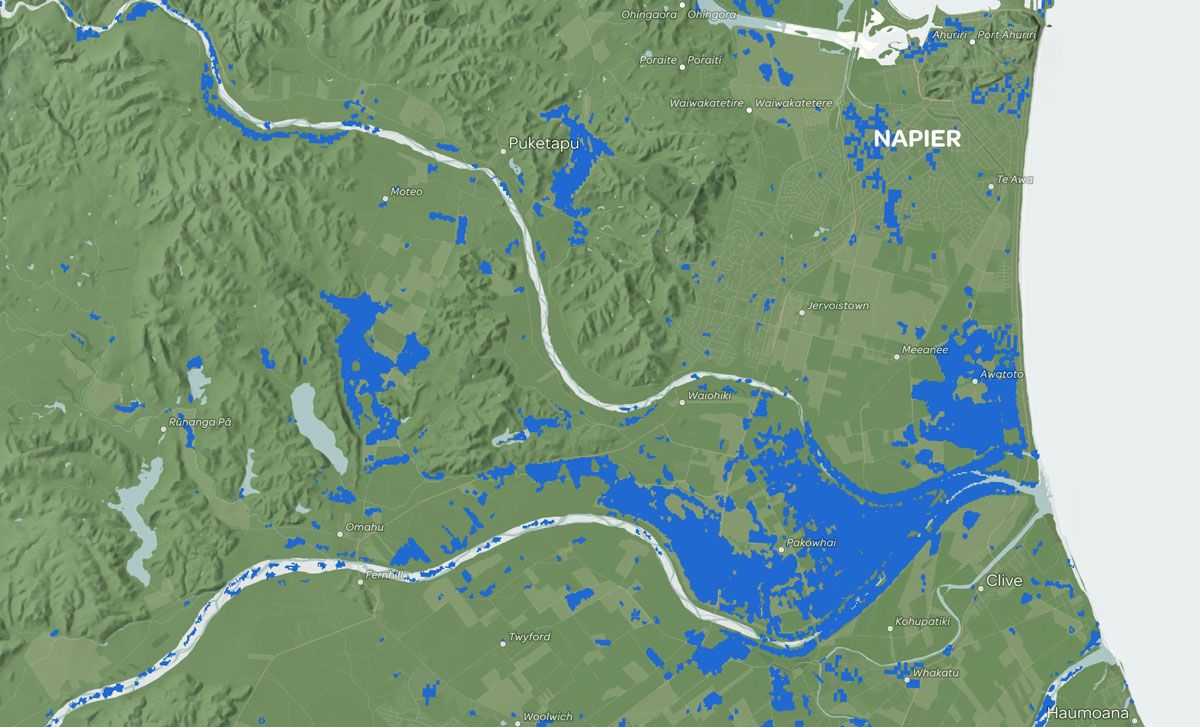
Flooding extent: February 19 and 21 2023
The updated data was prepared using before and after images of vegetation, based on the normalised difference vegetation index from imagery collected by the Sentinel-2 satellite. This index picks up changes in vegetation, soil and water. The differences in the index highlighted silt, slips and inundated areas and show the extent of the flooding.
The before images were from 5 January–10 February and the after images were from 19 and 21 February. Some areas of cloud may remain in the Sentinel-2 dataset despite our cloud removal processing.
The data is available for download below.
Flooding snapshot: February 14 2023
A snapshot of the flooding was taken during Cyclone Gabrielle, using synthetic aperture radar (SAR) data from the Sentinel-1 satellite. SAR is not affected by darkness or cloud cover. This enabled the water levels to be captured at 8.07pm on Tuesday 14 February when the satellite happened to be overhead.
Dragonfly data scientist Sadhvi Selvaraj located and analysed the Sentinel-1 and Sentinel-2 data.
“The initial map doesn’t show the full extent of the flooding – only the flooding that had occurred by the time the satellite image was recorded. Also, the map hasn’t been validated by what we’ve seen on the ground.”
Ian Reese created the maps using QGIS. The imagery was processed in Google Earth Engine, using methods based on those recommended by the United Nations Platform for Space-based Information for Disaster Management and Emergency Response.
Sadhvi says SAR data is useful for mapping floods in open areas, but may not accurately show flooding in urban areas. "That’s because the data is acquired by sensors that send and receive microwave signals at a slant angle, so buildings can block the signals and create inaccuracies.”
Email Dragonfly Data Science to find out more about satellite imagery and technical details of the analyses.
More information
- Download North Island flood map data as SHP.
- Download North Island flood map data as GPKG.
- Download Hawke's Bay flood map data from February 19 and 21.
- Download Hawke's Bay flood map data from February 14.
- Read more about QGIS mapping.
The flood map data is released under a Creative Commons Attribution-ShareAlike 3.0 IGO licence.