

Chris built a nifty feature into the website for the Regional Economic Activity Report (REAR) that lets you embed selected maps or charts into your own website. The embed feature has been used by New Zealand Herald in the data insights pages.
The Herald picked out a chart about tourism spending in Matamata as a hook for a story about regional economies. This example shows how the embed feature can extend the reach of the REAR report website.
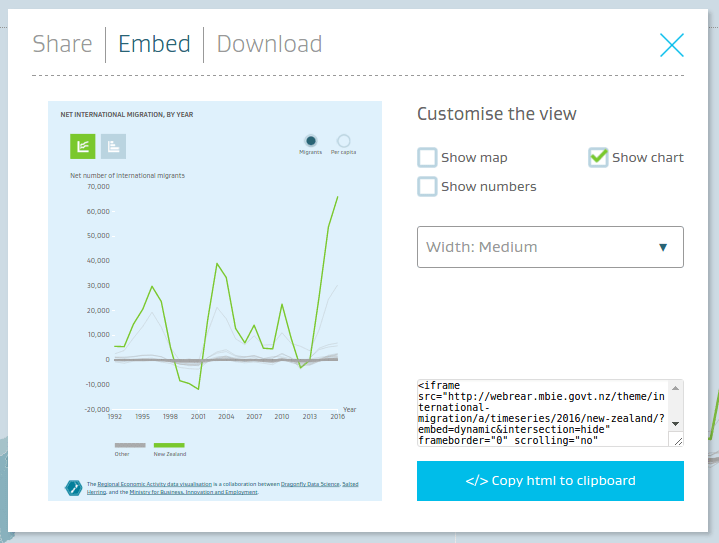
To include these charts in your website, navigate to a page you are interested in and click on the share icon at the top right of each chart. This function will bring up the share dialogue, and you can customise which components from the page you want to embed. By pasting the HTML into a page of your website or blog, that specific content will be displayed.
To make things nice and tidy, we have included hooks to the iFrameResizer javascript library in the embed. If you include that library in your website, you will be able to dynamically change the size of the embedded chart so that it always displays well on mobile phones.
As an example of embedding in action, data for net international migration to New Zealand for the year to March 2015 is embedded below. Immigration in the most recent year was much higher than in any other year since 1992.
The Regional Economic Activity Report was developed by Dragonfly for the Ministry of Business, Innovation and Employment. Read more about the project.