

Dragonfly has created an interactive web tool to present information on population, employment, GDP and annual household income across the country’s 66 territorial authorities for the Ministry of Business, Innovation and Employment (MBIE).
It is available from the MBIE website in desktop and tablet versions, and an app is planned.
The tool is the result of five month’s work with the Sector Performance Team and is a flagship project for Minister Steven Joyce. Joyce was keen to demonstrate the broad range of economic activity in the country, but realised that accessing the data was difficult.
“All the data is available in other reports but it’s never been integrated and easy to explore like this before. The level of detail was also requested by the territorial authorities, as it informs their policy and planning around resources, business management and permitting,” says Finlay.
Chris led the project, with support from Yvan and Finlay, and incorporated some sophisticated data management into the tool.
“There are not many things as complicated as this out there. It’s got databases, R-code for laying out the plots and figures and JavaScript to glue it all together.”
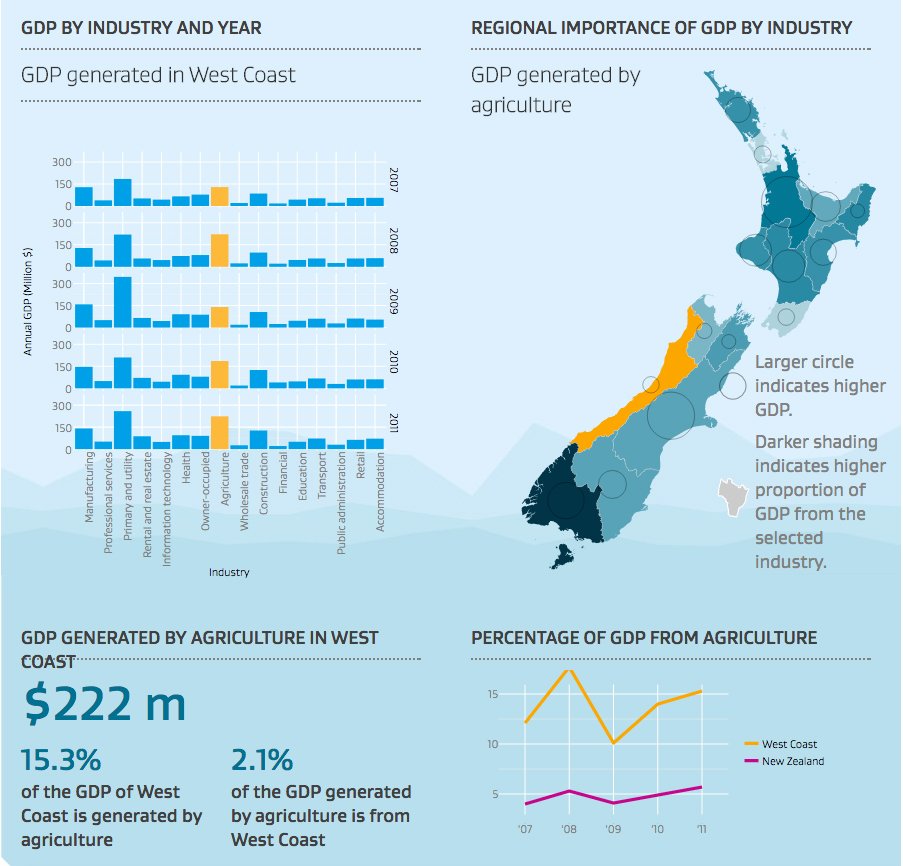
Information is displayed in different ways in three places, including a map of New Zealand. “There’s a single source of data but it’s coded to flow seamlessly through to all the interacting graphics. By moving a lot of the processing work to people’s browsers and tablets, rather than using a server, we got a faster and more interactive result.”
Chris says the project has been lots of fun. “It’s been great. We started out with an idea of how it was going to work and it’s ended up being quite close to that.”
He has also enjoyed finding out some quirky facts and figures along the way. “Where else would you learn that 1.8% of the retail spend in Dunedin was by visitors from the Bay of Plenty?”