
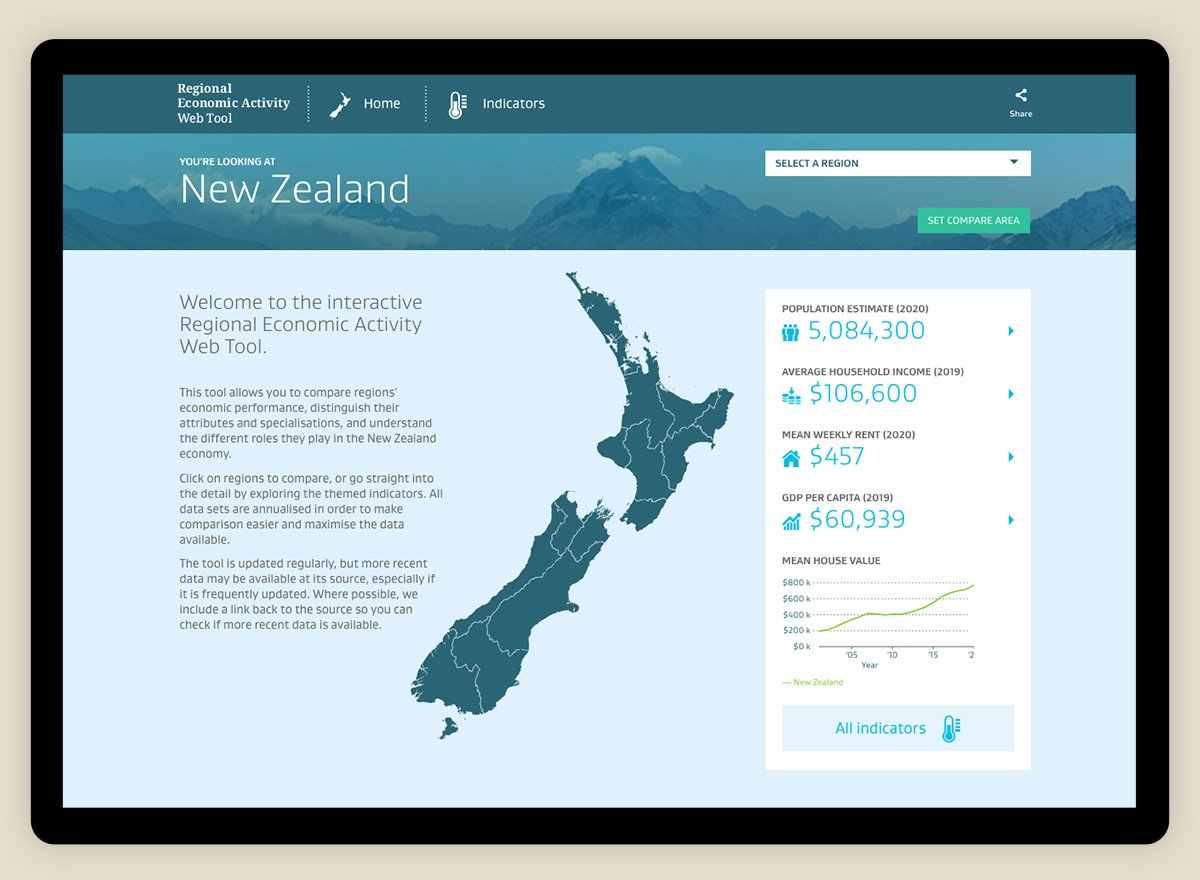
This project put data on New Zealand’s regional economies online, making the information widely available. We created a desktop version and iPad and mobile apps to help people explore the numbers.
Economic activity by region
The Regional Economic Activity Report presents data on a broad range of economic activity in New Zealand. As part of the government’s Business Growth Agenda, Minister Steven Joyce wanted to make the report accessible to a wider audience by creating an online version. Regional and city council staff had also requested access to more detailed information, to inform their policy and planning around resources, permitting, and business management.
How we made it happen
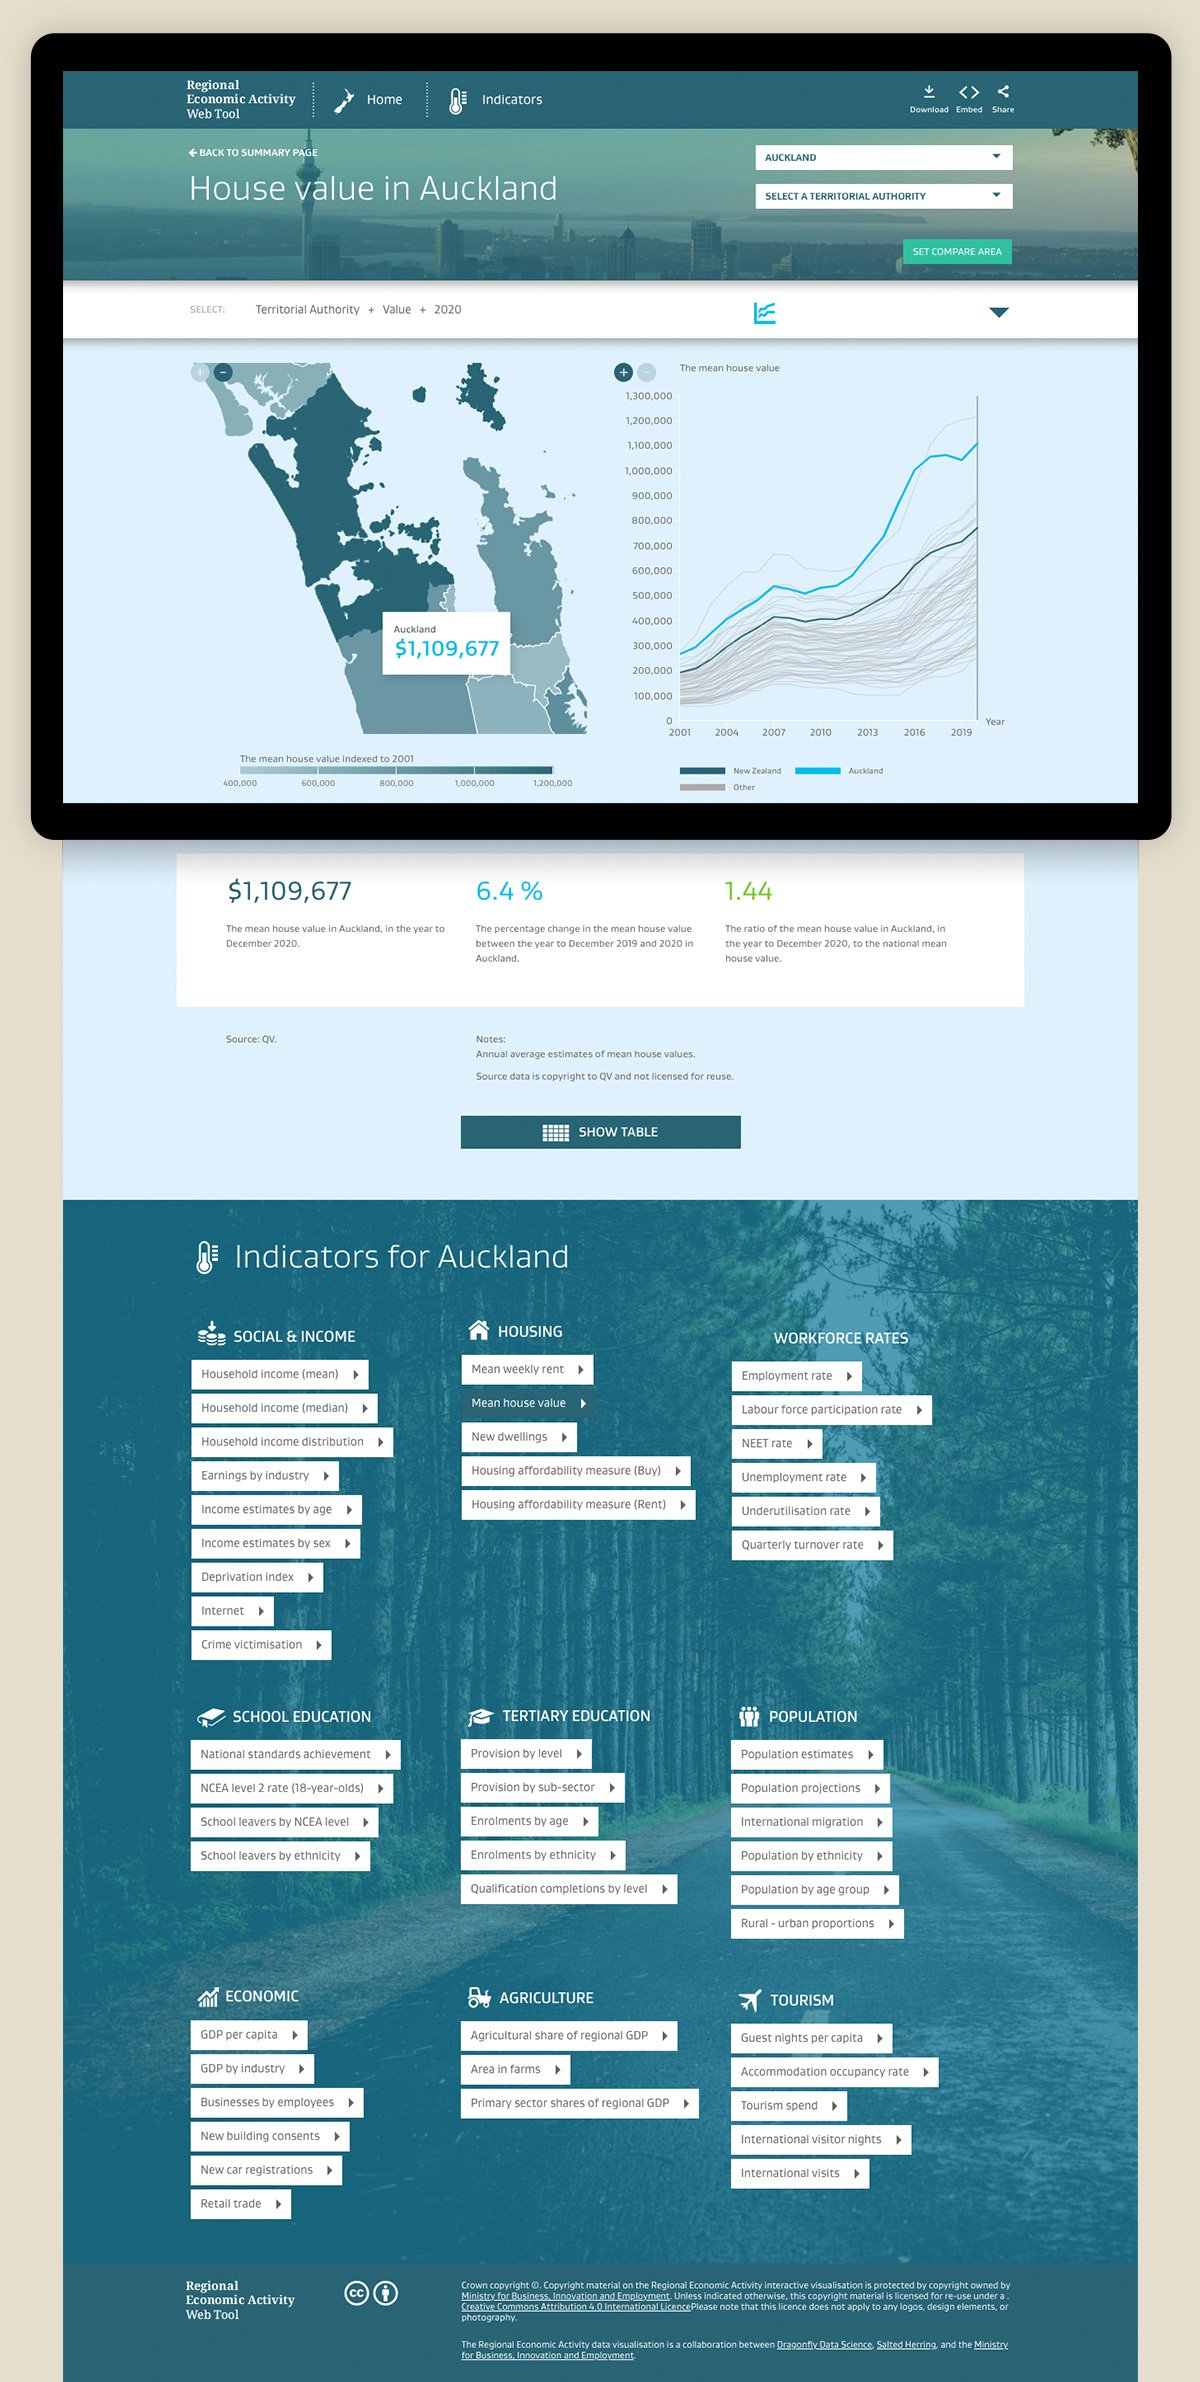
We built an interactive desktop version of the report, which was then released as an iPad and mobile app. A single source of data flows through to the report, the website, and the apps, to ensure the integrity of the data across all the presentations. We worked with digital design agency Salted Herring to create a look and feel that matched the Ministry’s own styles. Charts and maps were drawn using the statistical software R, and we used the EmberJS web framework to create a responsive, dynamic website that could also be cost-effectively delivered as a mobile app.
A team effort
To successfully deliver the project, we worked with a large team of up to 30 people across the Ministry for Business, Innovation and Employment (MBIE) and externally. We were able to coordinate this team and deliver the website, following an extremely tight timetable to meet the Minister’s release date.
I believe Dragonfly’s interactive is one of the best visualisations of public data in New Zealand. It presents different dimensions of the data and puts things in perspective by highlighting the relationship between various areas.
And just from a technical perspective, I think it’s a very polished product.
Harkanwal Singh
Data Editor
New Zealand Herald .